
Date I have worked on: January 2018 to Present
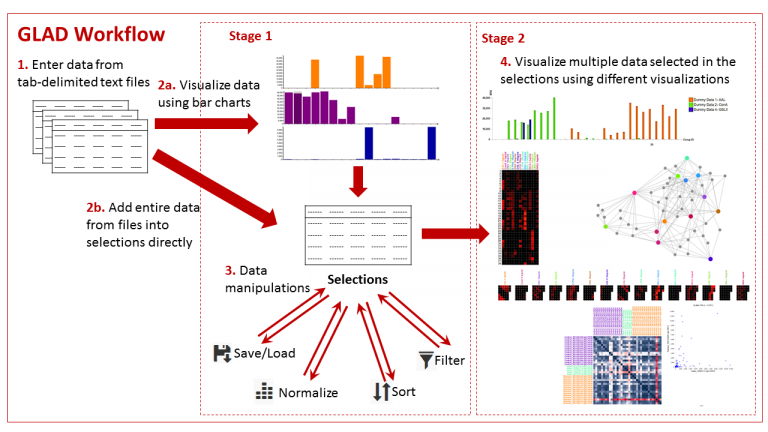
GLAD (GLycan Array Dashboard) is a tool to visualize, analyze and compare glycan microarray data. I used JavaScript libraries D3.js, Lodash, jQuery, Bootstrap, jStat and Select2.js to build this. This was the first official project where I started to learn JavaScript and libraries like D3js and Lodash for data wrangling and visualization.
To learn this I found the following website very useful: called Learn JS Data which now has a more updated version at Learn JS Data guide at Observable.
The following are some important links for GLAD:
- Homepage and documentation is located at: https://glycotoolkit.com/GLAD/
- To use the tool is located at: https://www.glycotoolkit.com/Tools/GLAD/
- The paper describing GLAD was published in the journal “Bioinformatics” and can be found at: https://doi.org/10.1093/bioinformatics/btz075
Cite as: Akul Y Mehta, Richard D Cummings, GLAD: GLycan Array Dashboard, a visual analytics tool for glycan microarrays, Bioinformatics, Volume 35, Issue 18, September 2019, Pages 3536–3537, https://doi.org/10.1093/bioinformatics/btz075

